Free GitHub Wrapped Generator
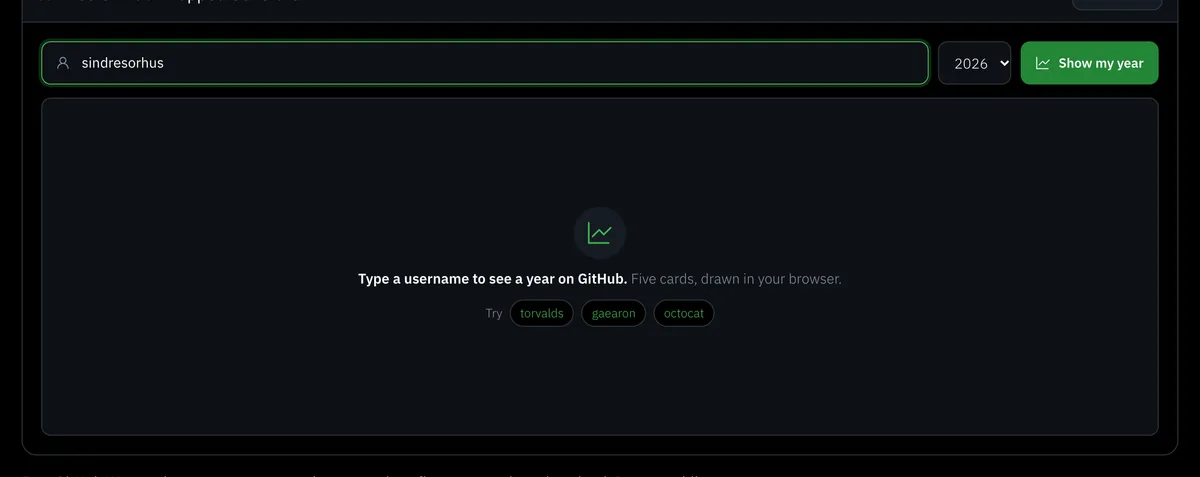
Type a username to see a year on GitHub. Five cards, drawn in your browser.
Try
Type a username to see a year on GitHub. Five cards, drawn in your browser.
Try
Free GitHub Wrapped: type a username and a year and get five story cards to download. It uses public data only, with no sign-in and no token.
Type a username and a year, and the page draws five story cards from that profile's public data: repositories, stars and forks, languages, your weekly rhythm and your busiest repository. Each card counts one thing you can check on GitHub yourself. Plain version: it is a year in review made of facts, ready to download as images.
| Card | What it shows | Where it comes from |
|---|---|---|
| Intro | The year, your name, followers and public repositories | The profile, as it is today |
| Building | Repositories created that year, repositories pushed to, and the stars and forks of the ones created that year | The repository list |
| Languages | Top five languages by number of repositories pushed to that year | The repository list |
| Rhythm | Most active weekday, usual hour, longest run of active days and the number of active days | Public events |
| Busiest | The repository with the most public events, and how many | Public events |
The repository list is read in up to two pages of 100, newest push first, with forks left out. The events are the public events feed for the account, read in up to three pages of 100.
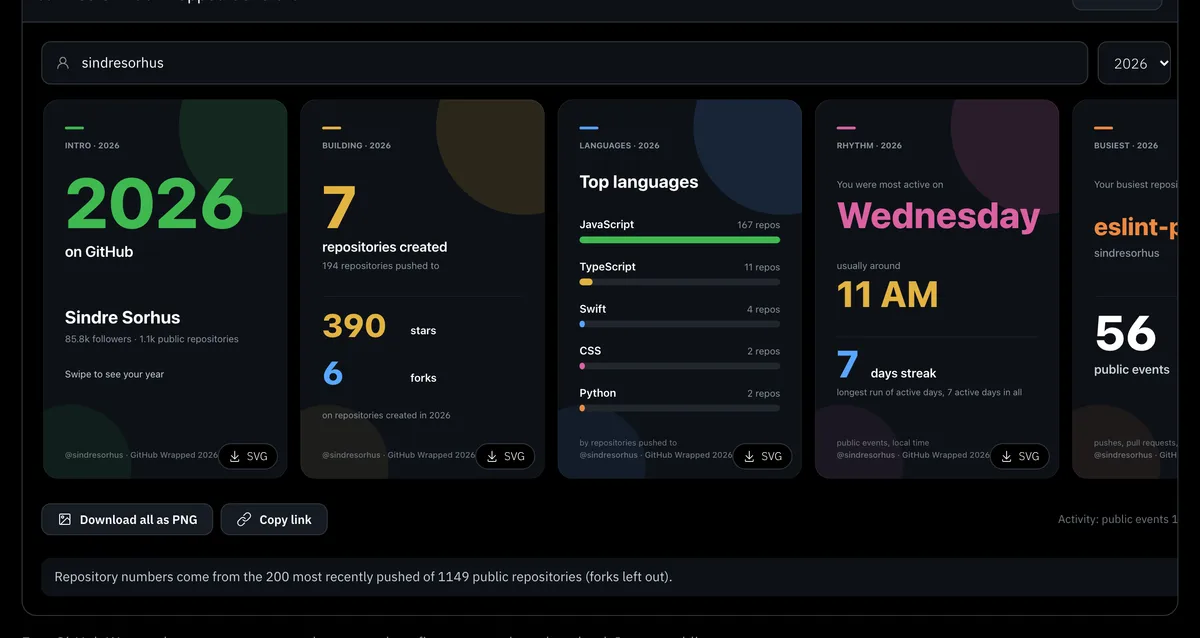
The Rhythm and Busiest cards depend on the account's public events. The tool states on screen that GitHub keeps only the last 90 days of them, and it reads at most three pages of 100, so 300 events is its ceiling. On a busy account the covered window can end up shorter than 90 days. The dates printed under the cards show the real range, so rely on them for the exact span.
The cards also leave out:
When a card has no data, it says "Nothing to show" and names the reason. Rhythm and Busiest turn up empty for any account with no public events in the window.
When an account has more public repositories than were read, a status line says how many of the total came from the most recent pushes.
For a past year the Intro, Building and Languages cards use the whole year, because they come from the repository list. Rhythm and Busiest need events from that year, and the window above rarely reaches back that far, so they stay empty or cover only part of it. The page shows a notice that says this. For the full rhythm of a year, run the page for the current year while it is current and save the PNG.
A card with a fact you can verify, such as your busiest repository or your most active weekday, gives a caption something specific to say. Write the caption yourself in a sentence or two and post the PNG where your developer network reads. If you want more people to see the post, free GitHub followers brings developers to your profile, and free GitHub stars helps the repository that took your year get noticed.
To see what else a profile shows, the profile analyzer scores twelve checks, and the worth calculator gives an impact score and an estimated reach. The star history chart follows a repository's stars over time. For the green contribution grid and private contributions, see our article on the contribution graph. To put live numbers in your README, use the stats card generator or the profile README generator.
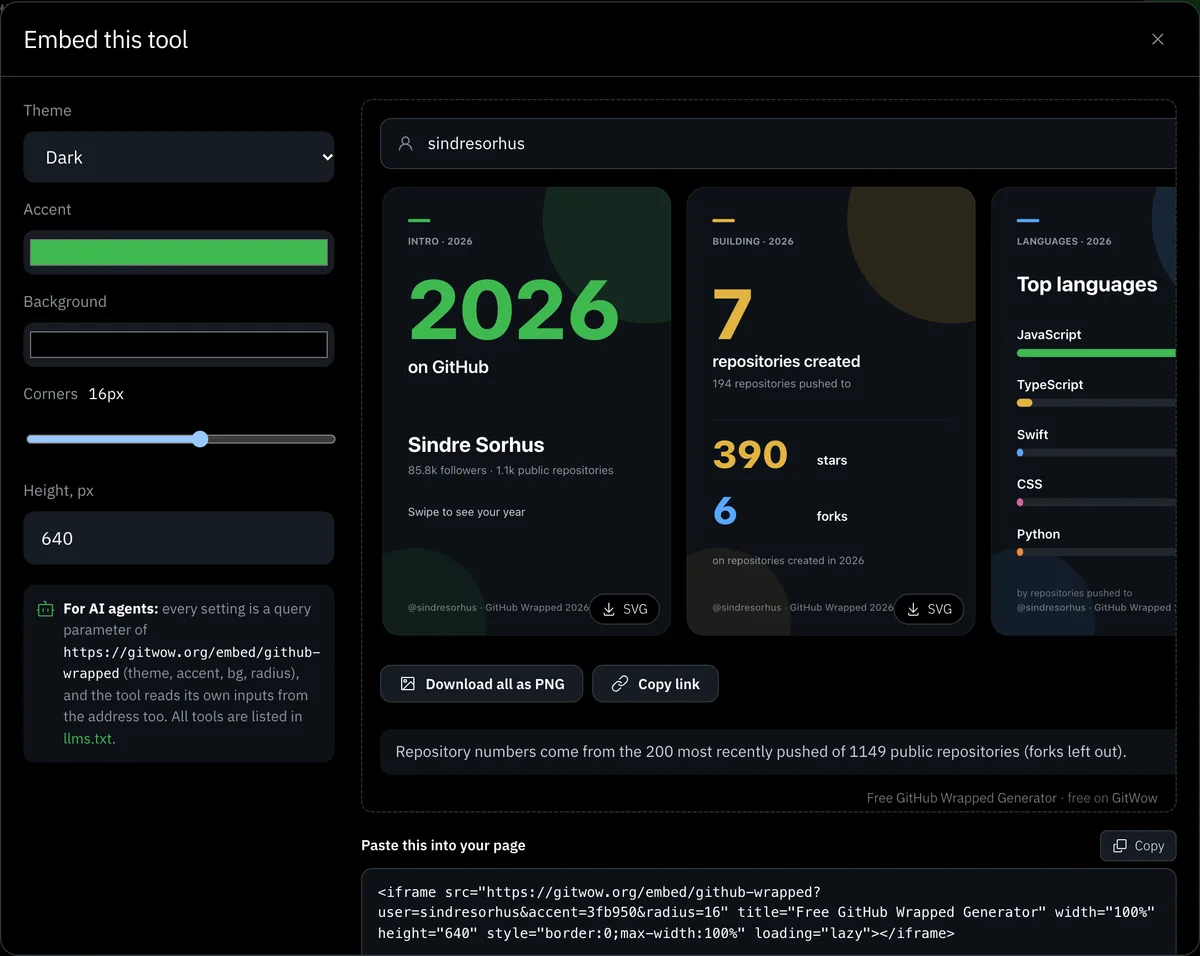
The Embed button beside the title opens a window with theme (dark or light), accent color, background, corner radius and height, plus a live preview and the iframe code. The embed is at /embed/github-wrapped, and this example link opens the 2025 cards for torvalds in a light theme. The parameters are user and year, and all tools are listed in /llms.txt, so an agent can open a link and read the result.
It is a year in review for a GitHub profile, in the style of Spotify Wrapped. Our version has five cards: intro, building, languages, rhythm and busiest repository. Each card counts something you can check on GitHub.
Enter your username, pick the year and press the button. The cards are drawn in your browser from public data, and the address then holds your username and year so you can share it.
No. Only public repositories and public events are read, and no sign-in or token is involved. For how GitHub's contribution grid treats private work, see our article on the contribution graph.
Rhythm and Busiest are built from public events, and the tool states that GitHub keeps only the last 90 days of them. An account with no public events in that window, or a past year, leaves those two cards empty. The dates printed under the cards show the range that was read.
Yes, from the year list, which holds the current year and the four before it. The Intro, Building and Languages cards work for any of them, and Rhythm and Busiest stay empty or partial because they need events from that year.
By counting repositories. Each repository pushed to in the chosen year adds one to the language GitHub lists for it, forks are left out, and the five highest counts are shown. Lines of code are not measured.
No, it is a GitWow tool. GitHub's own blog has featured a separate open-source project called GitHub Unwrapped, which gives stats and highlights on your year in code, so the idea is a familiar one.
Download all five cards as one PNG, or each card as an SVG, or copy the link. A caption with one fact from the cards, such as your busiest repository, gives the post something to say.
GitWow
47k members · 900+ actions a day
We use cookies to keep you signed in and to see which pages work. No advertising or cross-site tracking. Cookie policy