Type a username to draw the two cards. Everything is drawn in your browser.
Try
Reading the profile...Stats cardTop languages card
Download both SVG files, commit them to your profile repository (the one named like your username), then paste the Markdown into its README.md. The cards are a snapshot: download again to refresh them.
Free GitHub README stats generator: two SVG cards for your profile, drawn in your browser from public data, ready to commit next to your README.
Key takeaways
The generator draws two cards, stats and top languages, in your browser from public GitHub data in at most three requests.
You download SVG or PNG and commit the files, so the card is a file in your repository and no server draws it on each view.
The languages share counts repositories by main language. Other cards weigh bytes of code.
The card is a snapshot: download again to refresh it, or use Actions if you want a schedule.
Every card that a server draws from a URL shares one weak spot: when the shared server is slow or full, the picture in your README breaks. This generator takes the other route. It reads your public profile and repositories from GitHub, draws two SVG cards in your browser (a stats card and a top languages card) and gives you the files to commit next to your README. Nothing is requested from anyone when a visitor opens your profile.
Profile owners, students and open-source teams put the cards to different uses
A junior developer fills the empty top of a profile README with two cards that show real numbers.
A maintainer summarises stars, forks and the most starred project on the account page.
A student or bootcamp graduate attaches the cards to a CV link and checks the languages share before sending it.
A course author shows learners how a profile README is assembled and lets them draw their own cards.
A DevRel team keeps the same accent and corners across the profiles of its engineers.
Add the two cards to your profile README in three steps
1. Give it a username or a profile link
Paste your login or the profile URL and press Draw my cards. The tool reads the profile and up to two pages of 100 repositories, the most recently pushed first, in at most three requests. Nothing is asked of GitHub beyond public data, and no sign-in, token or password is needed.
Username and style options sit above the two cards.
2. Read the two cards, then adjust them
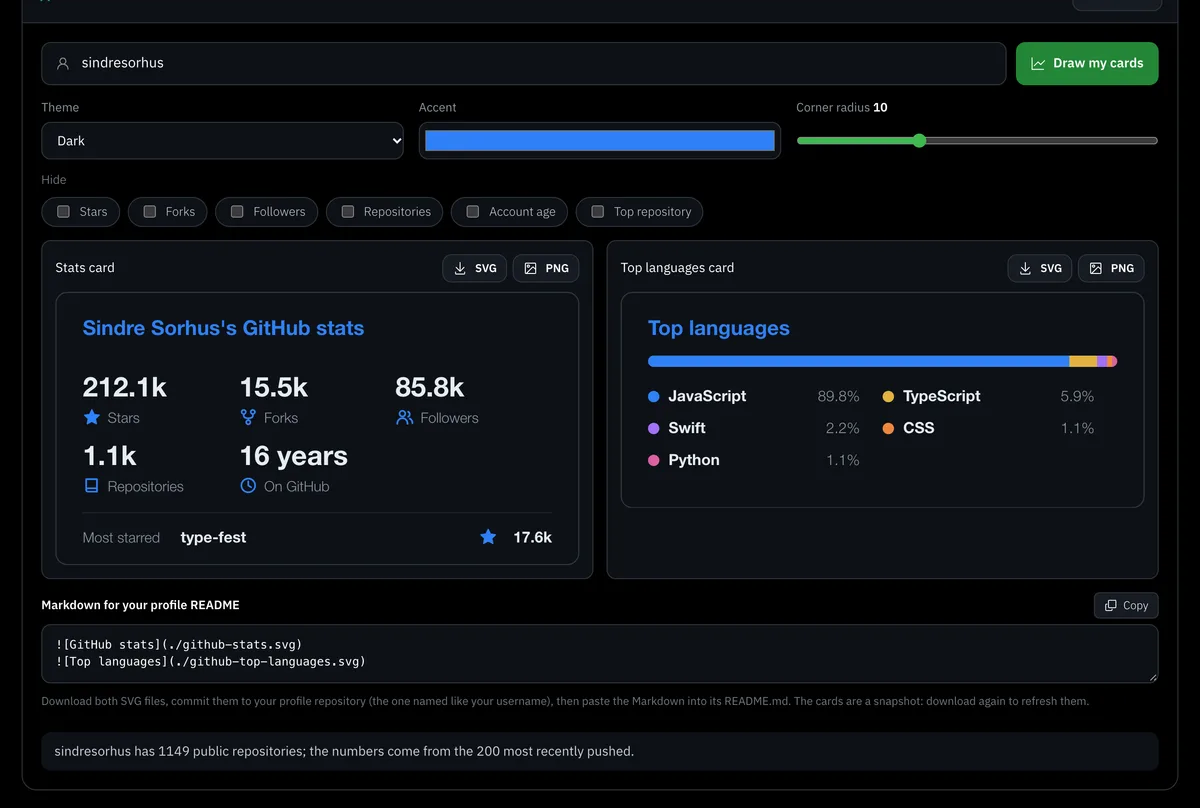
The stats card and the top languages card appear at once. Change the theme, accent colour, corner radius or the items you hide and both cards redraw. The next two sections explain what each number counts, so you know what a reader will take from the card.
The stats card and the top languages card, redrawn after each change of option.
3. Download the files and paste two lines
Each card downloads as an SVG or a PNG. Commit the two SVG files to your profile repository, the one named like your username, then paste the Markdown the tool gives you into its README.md. The lines link to files next to the README:  and . Where the whole README goes is covered in the profile README generator.
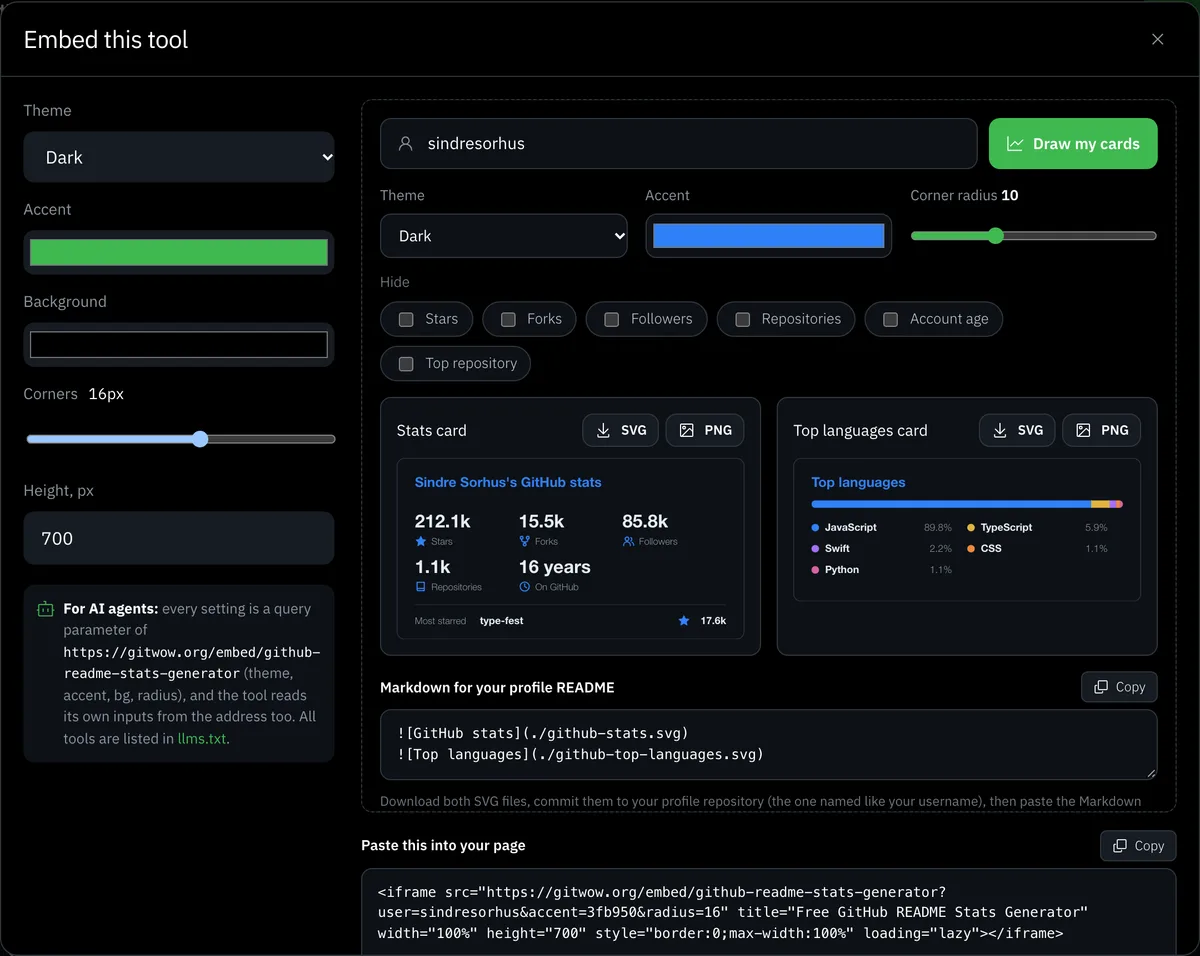
The Embed window carries your username and card settings into the iframe code.
Embed the cards elsewhere or let an agent draw them
The Embed button next to the title opens a window with a dark or light theme, an accent, a background, corners and height, a live preview and the iframe code with your current state in it. The embed lives at /embed/github-readme-stats-generator. The username and the hidden items are address parameters, such as user=octocat and hide=forks,age, so an agent can open the tool by link and read the cards it draws. All tools are listed in /llms.txt.
Know what each number on the stats card counts
The card shows six items and you can hide any of them.
Stars and forks are sums over your own repositories. Forks of other people's work are left out, so a fork you made does not add its stars.
Followers is the follower count from your profile.
Repositories is the number of public repositories on the profile.
On GitHub is the age of the account.
Most starred is your own repository with the most stars, with its count.
The sums come from up to 200 repositories, the most recently pushed. If your profile has more, the tool says which number it used. Private repositories are not read, and the tool never asks for a token to read them. Commits, pull requests, issues, rank and a streak are not on our cards. Services and Actions that draw those exist, and the comparison below shows where they fit.
Read the top languages card as a share of repositories
The card lists up to five languages. A language's share is the number of your own repositories whose main language it is, divided by the total of the five. Bytes of code are not counted. The original github-readme-stats weighs languages by bytes and looks only at your first 100 repositories, so the two cards answer slightly different questions. A tiny repository and a huge one count the same here, which suits a profile that shows what you build in, and misleads if you want to show where most of the code sits. If your top language by bytes differs from the card, this is the reason.
Compare a URL service, GitHub Actions and a downloaded snapshot
Method
How it works
Strength
Cost to you
URL service
An image address in the README, drawn by a server on every view
Set up in one line
Depends on the server and its cache
GitHub Actions
A workflow draws the SVG on a schedule and commits it
Refreshes on its own, can include commits and pull requests
A workflow file and a token to maintain
Our snapshot
You draw once and commit the SVG
Nothing to configure, nothing to go offline
You download again to refresh the numbers
The reliability facts come from the original project's own README. Its public instance on Vercel is called best-effort and can be unreliable because of rate limits and traffic. It caches stats cards for 24 hours and top languages cards for 144 hours, and cache_seconds accepts 21,600 to 86,400. The repository is marked as unmaintained, and it names GitHub Stats Extended and GitHub Readme Stats Action as successors. If you want live commits, an Actions workflow or one of those projects fits. If you want a card that cannot fail while you sleep, the snapshot fits. If your repository is the thing you want to grow, get free GitHub stars for your best repository and draw the cards again to show the new count.
Pick a theme, an accent and a corner radius that match your profile
Three themes: dark, light and transparent. Dark and light draw a background and a border. Transparent draws neither, so the card takes the page colour, and its text uses one mid grey. The accent colour paints the title, icons and the first language colour. The corner radius runs from 0 to 30. All colours are written into the SVG as plain attributes, so the card looks the same wherever the file is shown. Match the accent to your avatar or your pinned repositories, and put the cards next to a views counter, repository badges or a star history chart.
Understand why any card lags behind GitHub
A downloaded card is a picture of the day you drew it. Between drawings, stars move and repositories change. Cards that count commits meet a second delay: GitHub's repository statistics are expensive to compute, so GitHub returns cached data when it can. On a first request it can answer 202 while it calculates, and all of its statistics leave out merge commits (GitHub's statistics API). The answer to both delays is the same: redraw when the numbers matter, such as before you send an application, and let a workflow do it for you if you want a schedule.
FAQ
Frequently asked questions
How do I add a GitHub stats card to my README?
Draw the cards for your username, download both SVG files, commit them to the repository named after your username and paste the two Markdown lines into its README.md. The lines link to the files next to the README, so the card loads from your own repository.
How do I hide individual stats on the stats card?
Tick the items under Hide: stars, forks, followers, repositories, account age and top repository. The card redraws at once. If every item is hidden, the card says so.
How do I show additional individual stats on the stats card?
Our set is fixed at six items. Commits and pull requests come from the original service or from a GitHub Actions workflow. Both are separate projects and work differently from this one.
Why does my card show only public repositories?
The tool reads public data and asks for no token. The original project also sees only public repositories by default, and counting private ones needs a token of your own.
Will the card update by itself?
No. A card is a snapshot, so download it again to refresh it. A GitHub Actions workflow can redraw on a schedule if you want that. The cards in your repository stay the same until you replace the files.
Why do the top languages differ from other cards?
Our share counts repositories by their main language. Other cards weigh bytes of code. A language with one huge repository can lead by bytes and fall behind by count.
Is the card safe to commit?
It is a plain SVG with no scripts and no outside requests, and its colours are written as attributes. It looks the same in a README, in a browser tab and in a PNG export.
GitWow is a free community for growing your GitHub repositories and profile with help from other members.