See when a repository's stars arrived, not only how many it has
The star count on a repository page is one number. This page turns it into a curve: paste owner/repository or a GitHub link, and the chart shows how the stars piled up from the first one to today. Add up to six repositories to compare their growth. You leave with a picture to save, a CSV of the curve and a link that reopens the same chart.
Maintainers, learners and teams use the chart for different jobs
- A maintainer before a launch draws the repository, then returns a week after the release post to see what that week did to the slope.
- A junior developer with a portfolio project saves the SVG and puts it near the top of the README, where a visitor sees steady interest at a glance.
- A course author puts three libraries of different age on one chart with Align timelines on, to show how each one's first year went.
- A DevRel team overlays its project and two neighbours before writing a quarterly update.
- A developer choosing a dependency checks whether the curve still climbs or went flat years ago.
Three steps: give a repository, read the curve, take the chart with you
Give it one or more repositories
Paste owner/repository or a full GitHub link and press Add to chart. The four Try buttons (facebook/react, vercel/next.js, denoland/deno, ollama/ollama) fill the chart in one click. Each repository becomes a chip with its live star count and a remove button. A seventh repository gets a message asking you to remove one first.
Read the curve and the two switches
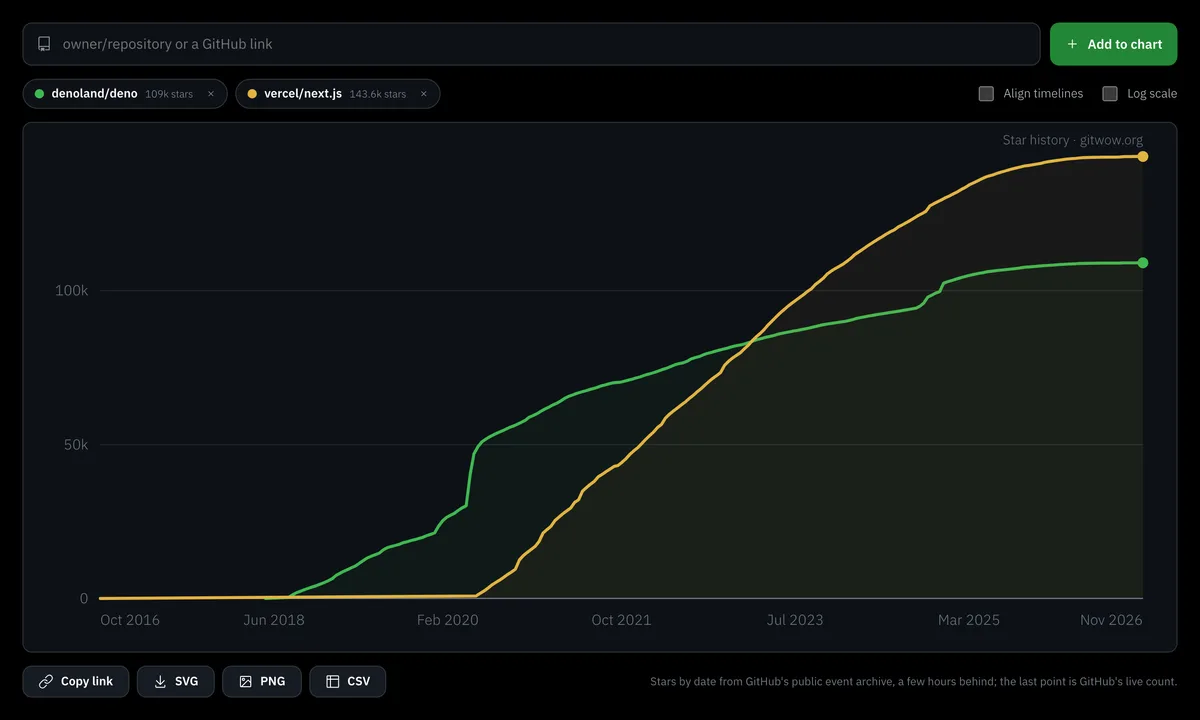
Each repository is one line with a dot at its end. Move the cursor over the chart and a tooltip lists the date and the star count of every repository at that moment. Align timelines and Log scale change the layout, and the sections below say when each earns its place.
Take the chart away
Copy link, SVG, PNG and CSV sit under the chart. The Embed button next to the page heading builds an iframe of the same chart for your own site. Pick the one that matches where the chart will live.
The curve ends on GitHub's live star count, and here is how it is built
The shape of each line comes from GH Archive, the public record of GitHub events. The last dot comes from GitHub itself. For every repository the chart does four things.
- It counts star events in the archive per week, or per day for a repository younger than two years.
- It adds the counts into a running total that starts at zero on the day the repository was created.
- It multiplies the whole total by one ratio: GitHub's current star count divided by the archive's total.
- It adds a last dot for today at GitHub's live count, and thins a long curve to about 300 dots.
The ratio exists because the archive and GitHub's counter count different things. The archive logs a star when it is given. GitHub's number drops when someone removes a star, and GitHub's engineering write-up says that when someone removes a star, that record is removed (github.blog). So the archive total and the number on the repository page can differ, and that is normal. Plain version: the shape is the archive's, the height is GitHub's.
One ratio covers the whole curve. If 3 percent of all stars ever given were later removed, every stretch of the line is lowered by the same 3 percent, and last month carries the same cut as the first year. We cannot see in which weeks the removed stars were given, so the chart does not guess. The same ratio absorbs stars the archive never recorded, and the chart does not display it. A renamed repository keeps its older stars under the old name, so we ask the archive for both names.
The archive runs a few hours behind GitHub, so the stretch between its latest week and the final dot is a straight segment, and the tooltip interpolates along it. If the archive has nothing for a repository yet, usually because it was created or first starred in the last few hours, the chart draws a straight line from the creation date to today's live count and says so under the chart. Check again a few hours later for the real curve.
What to do now: quote the live count from the chip when you need a number, and use the curve for dates and speed.
Since June 2026 GitHub lists stargazers only to admins, and star history still works
GitHub announced on 30 June 2026 that the stargazers list, the /stargazers page and the matching API endpoint are limited to repository admins and collaborators (changelog). A growth curve needs no names. It needs the date of each star, and the public event archive has that for any public repository, yours or not. The counter on the repository page stays public. For the people behind the stars, use the Free GitHub Stargazers Checker.
In September 2026 GitHub also added an endpoint that returns star counts by calendar week with no data about people (changelog). For react/react, with about 251,000 stars, the old route took about 2,511 requests and the new one about 24, and one request covers up to 30 weeks. Our chart reads the archive instead, which answers with one request per repository. The old stargazer list also stopped near 40,000 entries, according to the tools that read it, and tools that sampled it joined their samples with straight lines. That is why curves of very large repositories sometimes look too smooth in the tail.
Compare up to six repositories without fooling yourself: align the timelines, use log scale
On a plain chart each repository sits on its calendar dates, which answers one question: who was big when. Two switches answer fairer ones.
| Switch | What changes | Use it when |
|---|---|---|
| Align timelines | The horizontal axis counts days since each repository's first star. | The projects started in different years and you compare their first months. |
| Log scale | Each tenfold step (1, 10, 100, 1k) gets the same height. | The counts differ by orders of magnitude. |
On a linear axis a project with 2,000 stars next to one with 200,000 looks like a flat line on the floor, whatever it really did. On log scale a steeper line means faster relative growth. The gaps in absolute numbers shrink, so read counts from the tooltip and the chips, and read slopes from the lines. Put both switches on to compare projects of different age and size.
What to do now: press Try on facebook/react, add vercel/next.js, switch Align timelines on and compare the first 365 days.
Read the shape: spikes, plateaus and slow climbs
A repository with a huge total can have stopped growing years ago, and only the curve shows when the growth happened.
- A spike is a near-vertical step: many visitors arrived within a day or a week, usually after a release, a post or a mention. Open your notes for that date and write down what you did.
- A plateau is a flat stretch. It says few new visitors starred in those weeks. It does not say why, so look at what changed around its start.
- A slow climb is a steady slope with no steps. New stars arrive at a similar pace each week, and the angle shows that pace.
There is no "today plus N" box. To read the pace over a week or a month, put the cursor on two dates that far apart and subtract the two tooltip values, or export the CSV and subtract there. Repositories older than two years have weekly resolution, so a single day cannot be read from them. Daily Stars Explorer marks mentions from Hacker News or Reddit on its curve. We draw no marks, so keep your own release dates next to the saved chart.
Share the chart as a link, or save it as SVG, PNG or CSV
The chart's state lives in the address: the repositories, Align timelines and Log scale. Copy link puts it on the clipboard, and opening it redraws the same chart.
- SVG is a vector file with the site name in the corner. Use it in a README or a slide.
- PNG is the same chart as a picture at double size, for places that do not take SVG.
- CSV has three columns, repository, date and stars, one row per dot on the curve, so it holds the curve and not every single star.
For a README, save the SVG or PNG and add it as an image, because GitHub does not render iframes there. The picture is static: export it again when the curve moves on. A star badge with a live number is the Free GitHub Badge Generator.
Embed the chart on your site, or hand the link to an AI agent
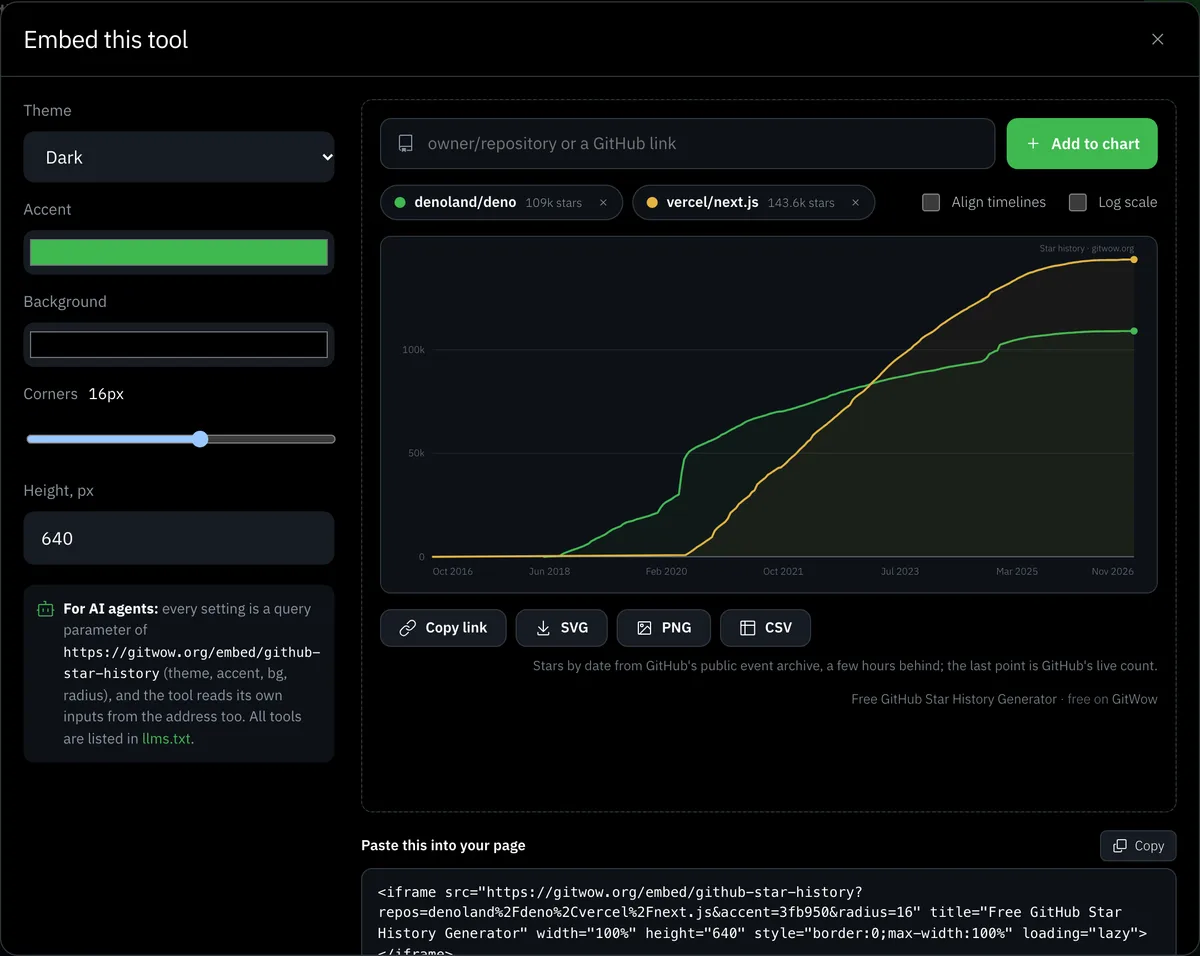
The Embed button sits next to the page heading. Its window offers a dark or light theme, an accent colour, a background, corner roundness and height, with a live preview and ready iframe code. The code carries your current chart, so the repositories on screen are the ones that get embedded, at /embed/github-star-history.
Every input is a parameter in the address, so an agent fills the tool without clicking. The address /embed/github-star-history?repos=owner/a,owner/b&align=1&log=1&theme=light draws two repositories aligned, on log scale, in the light theme. The page /llms.txt lists all the free tools, and the free tools catalog shows them to people.
Pick the method that fits: this page, a Chrome extension, an Action or a CLI
| Method | Good for | What you need |
|---|---|---|
| This page | A quick chart, several repositories, a shared link | Nothing |
| Chrome extension | A chart button on every repository page | The extension in your browser |
| GitHub Action | A picture in your repository that refreshes on a schedule | A workflow file and a commit step |
| Command line (npx, cargo) | A chart inside a script or a build | Node or Rust, and for some tools a GitHub token |
| Tracker pages (Repocharts, GStars) | Seven-day growth and the place in a chart | A browser. They do not compare arbitrary repositories |
Running your own copy makes sense for a team that needs charts in its own pipeline. We do not offer a self-hosted version of this page.
No token, no sign-in, and the chart is its own link
star-history.com asks for a GitHub token with no permissions at all, and dtolnay/star-history requires a token for GitHub's GraphQL API. This page asks for nothing: it reads the archive through the site's cache, so there is no token to create, store or leak. It is free, works without a GitHub account, keeps its state in the address and holds up to six repositories. It draws no event marks and does not rate a project as healthy or abandoned.
A flat curve usually starts with the README and the description
Good content grows any account, and in a repository the content is the README and the description. Before you look for traffic outside, open your repository as a newcomer would and check that the first screen says what it does and how to start. The Free GitHub README Generator drafts the missing parts, the repository description generator writes the one-line summary and topics, and the README guide shows what a good one holds.
Next, check that the project looks alive: recent commits, answered issues, a recent release. Then look outside, starting with how to get GitHub stars, and join the free developer community on the home page. Draw the chart again a month after any change: the slope after the change is the answer.